
table of contents
Urinary excretion heavy metal test
Urinary excretion heavy metal test results in August 2022
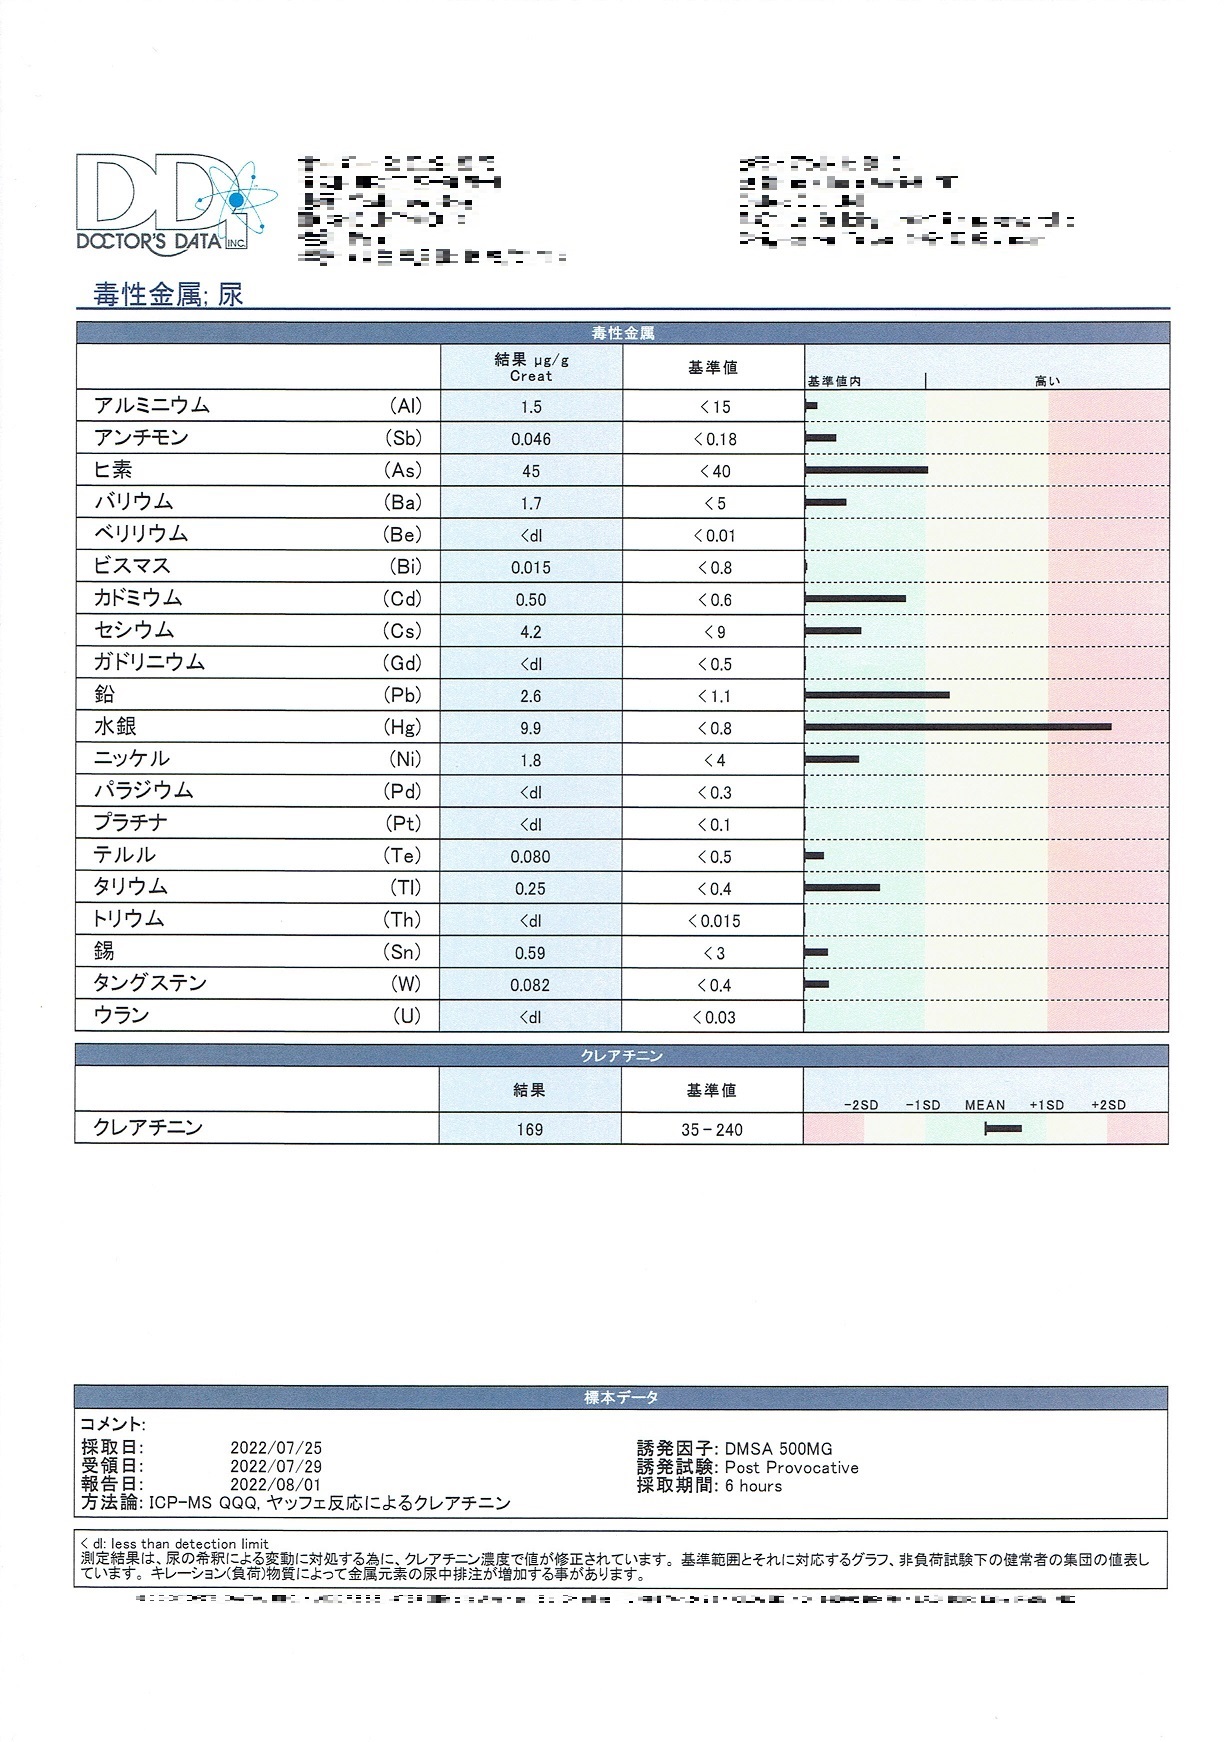
Urinary excretion heavy metal test
Harmful heavy metal
Result, Reference Value, Within Reference Value, High
Aluminum (Al) 1 5
Antimony (Sb) 0 046
Arsenic (As) 45
Barium (Ba) 1 7
Beryllium (Be) <dl
Bismuth (Bi) 0 015
Cadmium (Cd) 0 50
Cesium (Cs) 4 2
Gadolinium (Gd) <dl
Lead (Pb) 2 6
Mercury (Hg) 9 9
Nickel (Ni) 1 8
Palladium (Pd) <dl
Platinum (Pt) <dl
Tellurium (Te) 0 080
Thallium (Tl) 0 25
Thorium (Th) <dl
Tin (Sn) 0 59
Tungsten (W) 0 082
Uranium (U) <dl
Creatinine
Creatinine 169
Specimen data
Measurement results are corrected for creatinine concentration to account for variations due to urine dilution.
Reference ranges and corresponding graphs represent values for a healthy population under unloaded testing.
Chelating (loading) substances may increase urinary excretion of metallic elements.
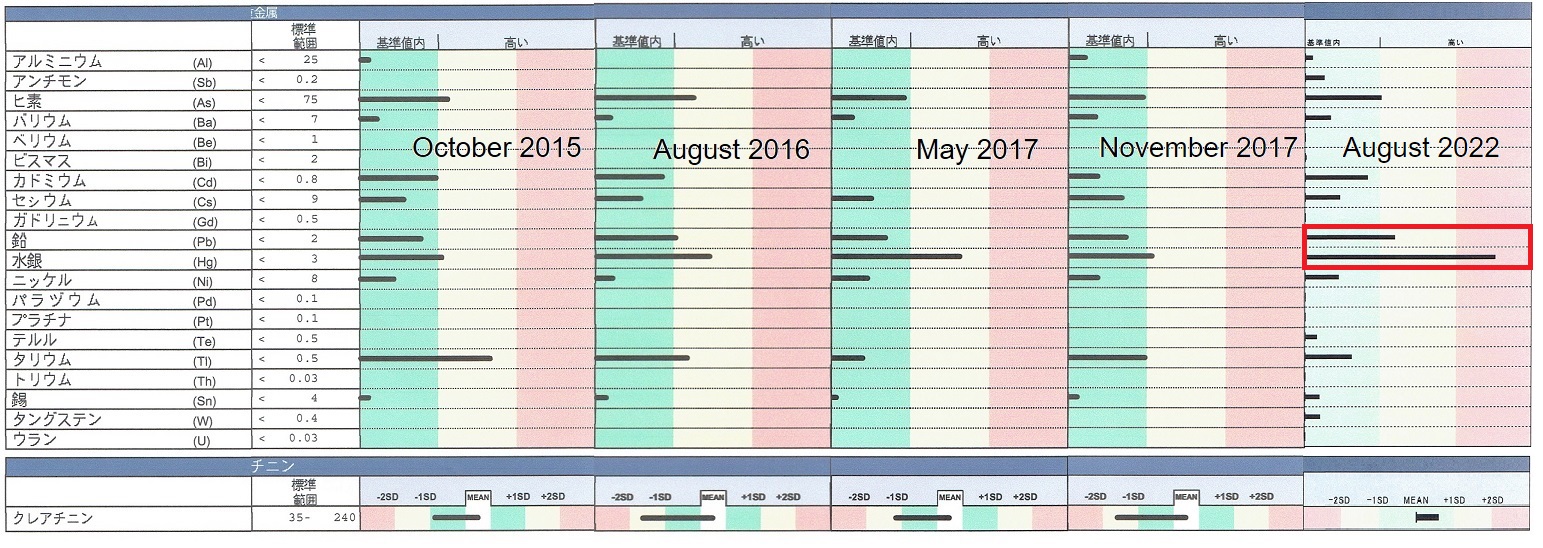
Comparison of test results
Comparative data is from October 2015, August 2016, May 2017, November 2017, and August 2022.
From the left: October 2015 data, August 2016 data, May 2017 data, November 2017 data, August 2022 data.
Urinary excretion Heavy metal test 20 items compared.
Numerical values and graphs are displayed separately.
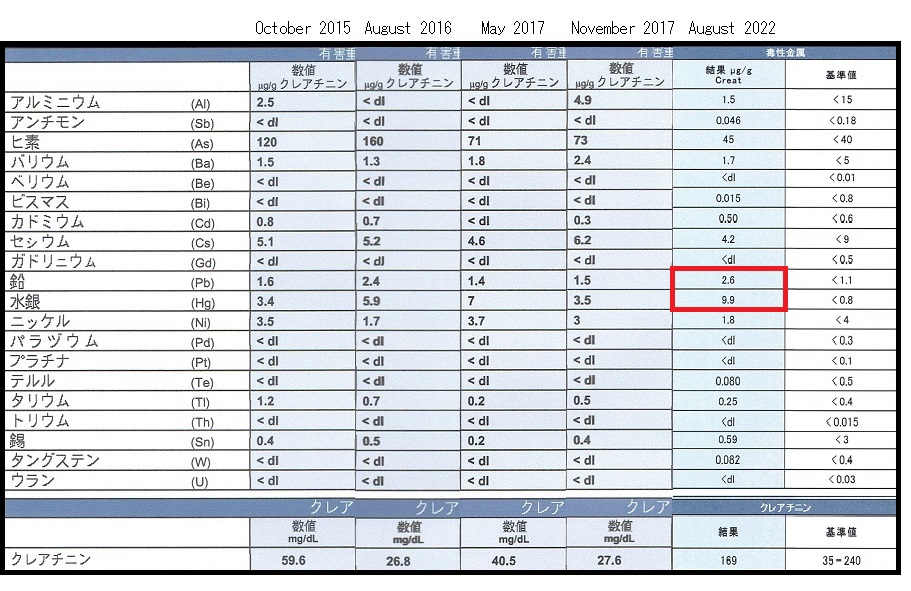
Aluminum (Al) 2 5 → <dl → <dl → 4 9 → 1 5 Go down
Antimony (Sb) <dl → <dl → <dl → <dl → 0 046 Go up
Arsenic (As) 120 → 160 → 71 → 73 → 45 Go down
Barium (Ba) 1 5 → 1 3 → 1 8 → 2 4 → 1 7 Go down
Beryllium (Be) <dl → <dl → <dl → <dl → <dl No detection
Bismuth (Bi) <dl → <dl → <dl → <dl → 0 015 Go up
Cadmium (Cd) 0 8 → 0 7 → <dl → 0 3 → 0 50 Go up
Cesium (Cs) 5 1 → 5 2 → <dl → 6 2 → 4 2 Go down
Gadolinium (Gd) <dl → <dl → <dl → <dl → <dl No detection
Lead (Pb) 1 6 → 2 4 → 1 4 → 1 5 → 2 4 Go up
Mercury (Hg) 3 4 → 5 9 → 7 → 3 5 → 9 9 Go up
Nickel (Ni) 3 5 → 1 7 → 3 7 → 3 → 1 8 Go down
Palladium (Pd) <dl → <dl → <dl → <dl → <dl No detection
Platinum (Pt) <dl → <dl → <dl → <dl → <dl No detection
Tellurium (Te) <dl → <dl → <dl → <dl → 0 080 Go up
Thallium (Tl) 1 2 → 0 7 → 0 2 → 0 5 → 0 25 Go down
Thorium (Th) <dl → <dl → <dl → <dl → <dl No detection
Tin (Sn) 0 4 → 0 5 → 0 2 → 0 4 → 0 59 Go up
Tungsten (W) <dl → <dl → <dl → <dl → 0 082 Go up
Uranium (U) <dl → <dl → <dl → <dl → <dl No detection
Antimony, bismuth, cadmium, tellurium, tin, and tungsten have increased values but are within the standard range.
Arsenic, lead, and mercury exceed the standard values.
The value of arsenic was 45 μg/g, slightly exceeding the upper limit of 40 μg/g.
The value of lead is 2 6μg/g, exceeding the upper limit of 1 1μg/g.
The value of mercury is 9 9 μg/g, which greatly exceeds the upper limit of 0 8 μg/g.
Aluminum is within the standard value, so there is no problem.
Antimony is within the standard value, so there is no problem.
Barium is within the standard value, so there is no problem.
Bismuth is within the standard value, so there is no problem.
Cadmium is within the standard value, so there is no problem.
Cesium is within the standard value, so there is no problem.
Nickel is within the standard value, so there is no problem.
Tellurium is within the standard value, so there is no problem.
Thallium is within the standard value, so there is no problem.
Tin is within the standard value, so there is no problem.
Tungsten is within the standard value, so there is no problem.
The results of the fifth test showed that heavy metals other than arsenic, lead, and mercury were within the standard range.
Arsenic and lead exceed the standard values, but they are not high.
Mercury far exceeded the standard value, and it was found that it was accumulated in the body.
It is thought that the mercury in the cells was discharged due to the effect of the tathion tablets that he was taking.
Taking Tathion tablets has a certain effect of discharging intracellular mercury.